Infrared thermography has been used for decades by skilled, trained users in a huge range of applications, from structural surveying of buildings through to electromechanical fault diagnosis, from tracking wild animals to clandestine military activities.
Ask any seasoned thermographer and they’ll regale you with tales of expensive, finicky equipment that had to be treated with kid gloves, was bulky and chomped through batteries. It wasn’t long ago that thermographic cameras had their own specialised on-board cooling systems.
However, times change, and it’s now possible to get a capable, functional thermographic device for a few hundred pounds which can be used straight out of the box, and which, with some basic understanding of the subject, can obtain accurate and useful temperature data quickly and easily.
This brings the technology within the practical range of those who aren’t trained thermographers, but who are interested in using the technology in electrical faultfinding, diagnosis and basic qualitative surveying. A thermographic camera can be something that lives in the back of the van (or a trouser pocket) which is there to be used a few times a week to help work more quickly and safely.
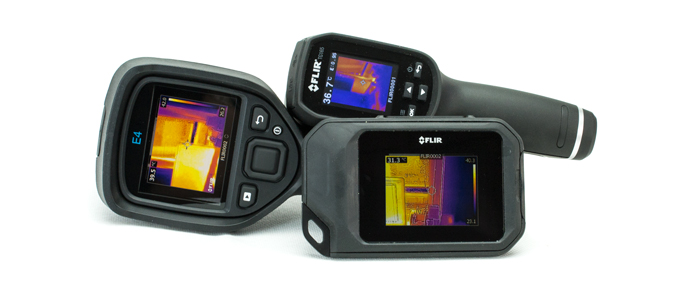
Major UK distributor www.test-meter.co.uk provided three thermographic devices from industry leader FLIR for testing. All are aimed at bringing thermography within reach of those in electrical and other technical industries who may want to use them for fault-finding and basic qualitative surveying.
Background
If you’re rusty on thermography, you may want to remind yourself of the basics:
Warm objects give off infrared radiation, which can be detected by thermographic cameras using a microbolometer array.
The amount of radiation given off depends mainly on the temperature of the object, and its emissivity.
Therefore if you know the amount of energy given off and the emissivity, you can quantify the temperature. This is how the camera determines the temperature of an object.
A thermographic camera will produce a false-colour image of a scene, and calibrate the colour scale, by defining a level (mid-point temperature colour) and span (range of temperature colours).
Capabilities
TG165
FLIR markets the TG165 not as a full thermographic camera, but rather as a turbocharged sibling to the simple infrared thermometer. It is based around the concept of a laser-targeted thermometer, but uses a small 80⨉60 pixel microbolometer array and a colour screen to display a thermal image around the sample point. Consequently it gives you much more useful information than an infrared thermometer, and is a far more sophisticated device, but lacks the additional functionality of even the more basic thermographic cameras.
No parameters within the camera can be changed manually with the exception of emissivity and display colour palette. There’s no scope for adjusting level or span manually; they are adjusted automatically by the device depending on the scene, and the level & span data are not recorded by the camera - only the centre spot temperature. This means you can determine a single temperature from the images produced, but not the range of temperatures or comparative temperatures of other points.
One big technical difference between the TG165 and its more expensive siblings is the lack of visible light camera, which means it misses out on MSX® image processing, and is not so suitable for any level of written survey use. Any images it produces are going to be for operator convenience such that further investigation can be made on the spot, rather than as a basis for detailed quantitative or qualitative analysis.
The TG165’s sensor actually has the highest temperature range of the three tested, from -25°C to 380°C with a sensitivity of 0.15°C.
The TG165 has a small 2” display which, combined with the lack of visible-light data and low-resolution microbolometer, doesn’t output images with the same degree of usefulness of either of its more expensive siblings.
C2
 The C2 is a somewhat revolutionary device in the world of thermographic cameras. FLIR has come up with a moderately capable beginner-level thermographic camera in a form factor reminiscent of a bulky smartphone, or an unconventional compact digital camera, with a touch-screen and a straightforward user interface. The concept is that you’ll be able to more-or-less use the device out of the box to get quick, easy results with a minimal learning curve.
However, there’s always a trade-off. In the C2, this comes in the form of the relatively low resolution (80x60 pixels), and lack of on-camera controls of more advanced features such as level and span. Span can be locked, allowing easier direct comparison between images, but not adjusted manually on-camera.
The low microbolometer resolution is mitigated by the use of FLIR’s proprietary MSX® image processing technology, which uses the camera’s conventional visible-light sensor (with a resolution of 640⨉480px) to interpret edges in the visible image and overlays this detail on the thermographic image. This can be switched on and off in-camera, and switching it on turns a relatively incomprehensible blurred mess into something which actually looks pretty decent and easy to interpret. It’s not foolproof however; in low-light conditions, the visual light camera won’t be able to extract sufficient information to enhance the thermographic image in any way.
On-camera adjustments to image parameters are limited to emissivity, reflected temperature and distance. Images can however be exported to FLIR Tools, which allows a much greater range of parameter adjustment.
There are 4 built-in palettes: iron, rainbow, rainbow high contrast, and gray [sic]. These can not be inverted in-camera.
The C2 features a clear 3” LCD display with touchscreen functionality, which is most welcome and helps bring these devices into the 21st century. It also has an LED which can be used as a scene light or a flash.
Thermal sensitivity of this sensor (the smallest temperature variation it can detect) is rated at 0.1°C, with accuracy (proximity to actual temperature) given as ±2°C or ±2% of the reading, whichever is greater. The sensitivity range is -20°C to 150°C. Therefore a stated temperature of 20°C indicates an actual temperature of 18-22°C, and a stated temperature of 150°C indicates a temperature of 147-153°C.
The built-in focus-free lens gives a field of view of 41°⨉31°. Not surprisingly, the C2 does not support interchangeable lenses.
E4
Coming from the more professionally-targeted E range, you’d expect the E4 to build upon the capabilities of the C2. However, it features the same resolution sensor (80⨉60 pixels), the same MSX® technology, and a similar 3” LCD, but without the touchscreen functionality.
The sensor has been uprated to a maximum 250°C, although the thermal sensitivity is stated as <0.15°C, or less sensitive in theory than the C2. Accuracy and visible-light resolution are the same, and the field of view is fractionally wider at 45°⨉34°.
Also like the C2, the E4 supports only limited parameter adjustment in-camera. The level and span are set automatically (although they can be locked), and the only manual adjustments are for emissivity, reflected temperature and distance.
The display options add an extra mode: thermal blending, which attempts to blend the thermal and visible light images. For most instances this will not be as useful as MSX® mode, as it makes the thermographic data more difficult to read, although some users may prefer it.
The E4 only supports 3 on-camera colour palettes: iron, rainbow and gray (compare this to the C2’s additional rainbow high contrast palette). It also lacks the C2’s LED flash.
All in all, although the E4 is positioned as the more capable device, it scores feature parity with the C2 in most respects, and in a couple of areas lags slightly behind.
Out of the Box
TG165
The TG165 ships in a retail style pack, including the camera with 8GB Micro SD card already installed. This can be expanded if required, although at this resolution 8GB will store a whole lot of images: around 100,000 by my reckoning. The card also contains some documentation and reference information.`
The pack also includes a lanyard, USB lead, basic manuals and a power adapter to charge using the USB cable, with changeable international pins. The battery is built-in, which has allowed FLIR to include a screw thread in the base of the muzzle for tripod mounting.
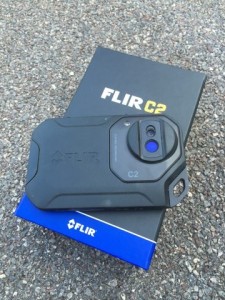
C2
Once you’ve actually worked out how to open the smart retail box, the first thing you reach is the camera, with its two buttons and USB port.
FLIR also provide basic manuals, a USB stick containing lots of documentation (but apparently not FLIR Tools, which you can download - this makes me wonder why they included the documentation, which could also be made available online), a lanyard, a USB lead and a charger block with USB output and interchangeable international prongs.
The C2 has a built-in battery and storage, with the battery rated at 2 hours’ continuous use. My computer reports the available capacity of the storage card as 174MB. There is no provision for tripod mounting.
If you want to keep the camera in good condition, you'll either want to use the sturdy cardboard box it comes in, or you’ll need to purchase something suitable for safe storage. The two camera lenses are unprotected and both they and the touchscreen are vulnerable to damage.
The body is a similar size to an iPhone 6 Plus, but somewhat thicker. The finish is rubberised with efforts made to stop dust ingress, such as sealed buttons; although FLIR does not publish an IPxx rating, it’s clearly been design to be relatively robust, lens and screen protection notwithstanding.
E4
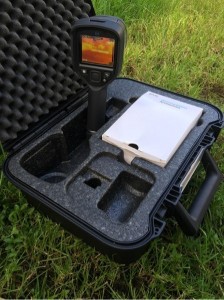
The E4 is supplied in a tough polycarbonate hard case, with foam and polystyrene inserts to protect the camera. Unlike the other two devices tested, the camera lenses are protected by a switch-operated cover. I’m a big fan of manufacturers providing proper protection for industrial equipment, and these inclusions will save you having to go out and buy extra bits to protect your investment.
USB cables and a USB charger with interchangeable prongs are included, along with a basic written manual and a CD with additional documentation.
The E4’s battery is removable and fills the base of the gun-style muzzle, but there is no screw thread provision for tripod mounting. For extended periods of use, the ability to swap out batteries may sway some users who would otherwise have considered the C2. FLIR rates the battery life for 4 hours of continuous use, twice that of the C2’s non-removable battery.
The E4 also has a rubberised finish with sealed buttons and again feels like a sturdy, well-protected instrument. The screen is recessed and covered with an additional sheet of glass. FLIR doesn’t publish an IPxx rating but there’s no reason this device should get damaged in everyday use.
FLIR provides a calibration certificate with the E4, befitting its intended use as a basic quantitative survey instrument.
In Use
TG165
The TG165 resembles a handheld radar gun in form factor. It’s intended for one-hand use. One button turns the device on (eventually) and it will start taking measurements within a few seconds.
The temperature measurement is limited to a simple spot temperature, which updates constantly on screen. Pressing the device’s trigger fires both lasers at your target, where they give a visual boundary of the area undergoing spot temperature measurements. The spot size is approximately 50mm at 1m. Releasing the trigger prompts the camera to ask you whether to save the image; unless you respond quickly (within 5 seconds), the software will assume you didn’t want to, and discard the image.
In practice, it’s easy to use the TG165 to scan an area with the trigger held down, looking for hotspots on the live display; if anything shows up, a glance at the laser beams instantly confirms the hotspot’s physical location. Unless you’re an experienced thermographer, the visual display alone is unlikely to give sufficient information to interpret what’s going on in the real world, so the laser beams are very useful.
The on-screen display shows the emissivity setting being used, the local time, battery state, spot temperature and presence of Micro SD card. The camera doesn’t appear to recalibrate its sensor; if it does, there is no audible or visual indication that it is doing so.
The menu button allows adjustment of colour palette, emissivity settings (4 preset values with somewhat obscure pictograms, plus a manual setting which can take any value), laser on/off, temperature scale (°C or °F), crosshair on/off, power-off time and date/time. The menu system is clear and simple to use.
You can connect the supplied USB cable to download card data to a laptop, but I found this hit-and-miss (the card was sometimes not recognised, and can apparently only be accessed with the camera turned off), and resorted to putting the card into a Micro SD adapter.
Images are saved in BMP format, and they are purely visual images without any embedded raw data or metadata: just the spot temperature and emissivity, which are graphically superimposed over the thermographic image. No image processing is possible using FLIR Tools (FLIR’s free infrared processing software) or other packages, and the level and span are not indicated on the images. This makes it impossible to calculate the temperature of any point on the image, for example to see how much hotter or colder one part is than the spot temperature. This seems to be a conscious design decision to reflect the product’s market positioning; clearly the sensor is capturing raw data which could be used, but FLIR has chosen not to make this accessible in this entry-level device.
C2
On power-up, the C2 takes a long 30 seconds to produce an image on-screen, although the user interface only becomes fully operational around the minute mark. The camera automatically calibrates itself several times on startup and continues to do so as it needs to. There is no facility for manually triggering calibration.
Level and span are set automatically based on the scene content, so the image will alter dynamically as the camera is moved or the scene changes. The level and span can be locked with a fingertap on the screen. This is especially useful when taking multiple images for direct comparison; without locking level and span, the colour palette in the images would map to different temperatures between different images (although level and span can also be normalised in software post-processing). There is no facility for manually setting level and span.
The screen shows span parameters and spot temperature by default, and indicates visually when calibration is taking place. The large, if sometimes hard-to-press, button on the top of the camera saves the currently displayed image.
A tap on the screen enables the menu system, which is unusually clear, well-ordered and usable. Menu options include:
- Playback of stored images, including easy options to switch between thermographic and visible light views.
- Adjustment of image display mode between Thermal MSX®, thermal and visible light options. There is also an option to choose alignment distance of the two cameras. The cameras are unable to occupy the same space in the device, which means there is a parallax alignment issue between the two which varies depending on subject distance. The menu option allows the user to choose the subject distance and the camera adjusts image alignment accordingly.
- Centre spot measurement on/off. There is no way to move the spot, adjust spot size, or switch to averaged area measurement, on-camera.
- Choice of 4 colour palettes.
- Use of the LED for image illumination or flash.
The menu also allows easy access to adjust some measurement parameters, specifically:
Emissivity: three simple presets can be accessed, or a custom value which allows any setting from 0.02 to 1.00. There is no database of common emissivity values for typical materials.
Reflected temperature, which can be set from -39°C to 2000°C, in degrees (low values) or tens of degrees (high values).
Distance to subject, ranging from 0.00m to 391m, in graduations of 0.25m (low values) or 1m (high values). Note that this setting is independent of the subject distance value used to determine parallax alignment of the two cameras. It may have been useful to allow these settings to be linked, to save setting a similar parameter twice.
Images are saved in JPG format, with both thermographic and visible images subsequently available to FLIR Tools. The thermographic image should be considered not as a rendering of what appears on screen, but as a capture of the data recorded by the camera. In fact, the only information “baked in” to the image is the sensor recordings, focus and composition. Every other attribute of the image can be changed in software: emissivity, palette, reflected temperature, relative humidity, atmospheric temperature and transmission. Changing these parameters will result in real-time recalibration of the image temperatures and rerendering of the colours.
FLIR Tools features a number of other useful capabilities. For example, rectangles, circles or polygons can be drawn on screen and average, high and low temperatures are calculated for the area in question. The resolution limitation of the C2’s sensor does come into play here: with only 4800 pixels in total, there’s not a whole lot of information to draw on if trying to extract data from fine details. Annotations can be made and images can be drawn on; the resulting metadata is saved with the image files, without making any changes to the original data.
FLIR Tools features a wider range of colour palettes than the C2 itself, including options for setting isotherms and threshold temperatures.
One feature I couldn’t find in FLIR Tools was the ability to re-align the visual & thermographic images. It seems that the setting made on the camera at the point the image is recorded is set in stone; simple drag-and-drop realignment would be useful.
In testing on my Mac, FLIR Tools was unable to display realtime images from the C2, or any of the other cameras tested here. It appears they don’t support this capability.
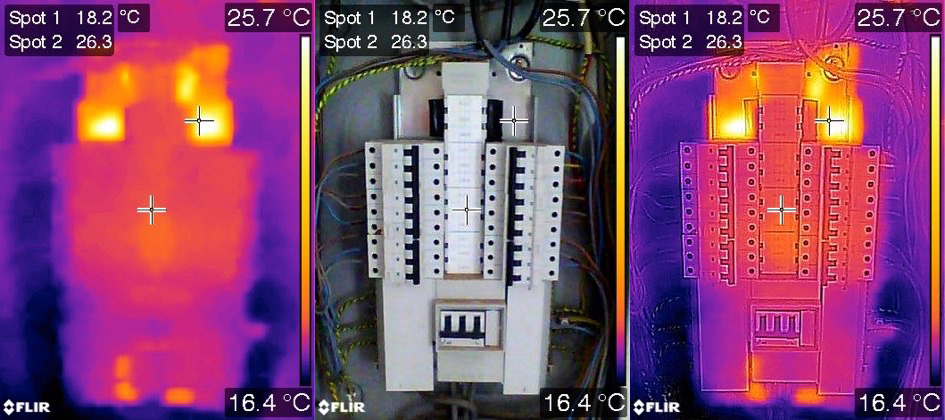
The same image of a 3-phase distribution board from the C2 rendered as thermographic, visible light and Thermal MSX® (with additional spot temperature added in FLIR Tools). Thermal MSX® mode enhances ease of interpretation. Note that the “hottest” part of the image is in fact the board’s rear plate where no electrical activity is present; this is most likely to be reflected heat from elsewhere and illustrates one pitfall in interpreting raw thermographic data.
E4
The E4 adopts the gun form factor of the TG165, although it has around four times the heft. The startup time is a matter of five seconds or so for a basic image, with thermographic data arriving in another two seconds. This means the user isn’t penalised for turning the camera off to preserve battery life, although nonetheless the camera should be allowed to acclimatise and calibrate prior to use.
In many respects the E4 behaves much as the C2: automatic calibration, automatic level and span with an option to hold this, and much the same menu system. Lacking the C2’s touchscreen, the E4’s menus are accessed using a simple joypad arrangement, with a dedicated button to access image playback. Accessing the camera’s whole range of functionality is fast and straightforward.
The emissivity menu expands on that of the C2 with a fairly decent range of 28 common materials pre-programmed, ranging from glass to cast iron, with some surprisingly specific data such as rusty iron and oak wood, and different subsets of steel and stainless steel separately. This obviates the need to commit a large range of material emissivities to memory, or carry around a crib sheet, for those who are aiming to obtain accurate quantitative measurements.
Images are captured using the “trigger” which is always easily accessible with an index finger.
Images are exported in exactly the same format as those of the C2, and consequently the full power of FLIR Tools is available to both devices. In practice I found it difficult to differentiate between the images of the two devices by purely visual inspection, which is perhaps not surprising given their lenses and sensors share much in common.
Example Uses
C2
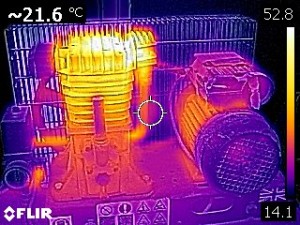 This Thermal MSX® image was taken straight from the C2 with no post-processing. It shows a motor-powered compressor which has been running for a few minutes. This is an example of when the ability to move the spot temperature measurement point would be beneficial; however this can all be done easily in post-processing.
The second version of the image has been post-processed in FLIR Tools. I’ve adjusted the level and span to highlight the areas of the image of most interest in greater contrast, and changed the palette to High Contrast Rainbow.
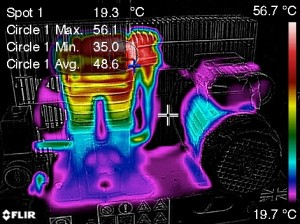 I’ve also drawn a circle (partly obscured by the legend, unfortunately) and data for maximum, minimum and average temperature for that circle are extracted automatically, with red and blue crosshairs (also partially obscured) showing the points of maximum and minimum temperature within the defined area.
Finally I’ve moved the spot temperature measurement point to an area of ambient temperature. FLIR Tools appears to give a smaller area for spot temperature measurements than the camera’s on-board processing.
TG165
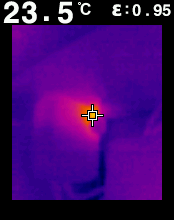
This image was taken when scanning around domestic consumer unit for hotspots which may indicate poor connections. Any area of high resistance will convert electrical energy into heat energy, leading to a temperature anomaly.
The rate of heat conversion depends on the resistance, and the square of the current; therefore, unless current is flowing, no heat anomaly will be present, but a large current will produce a very large anomaly.
The consumer unit checked out fine, but the TG165 picked up a temperature anomaly nearby. It’s difficult to make out the exact situation here purely from the thermal image (regarding which no post-processing is possible in FLIR Tools).
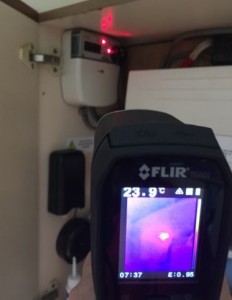
At this point, the lasers came in very useful, identifying the hotspot as an area on the surface of a Solar PV generation meter adjacent to the consumer unit. Given the magnitude of the anomaly this does not give great cause for concern.
Note that the lack of a comparative visible-light image means the analysis needs to be done in real time whilst using the instrument.
E4
This image is the E4’s interpretation of the same scene as above. Immediately the Thermal MSX® enhancement helps make a lot more sense of the scene, whether looking live or analysing the image some time later.
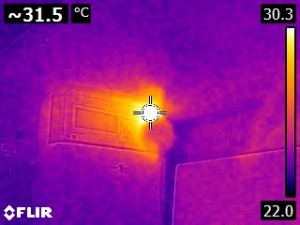
Note that the calibrated temperature scale tells us exactly how much warmer the hotspot is than the ambient temperature. The TG165 gives a spot temperature but no comparison. From the E4 we can see that the hotspot is around 10° above ambient. When touching the plastic surface with my finger, I was unable to detect any difference in temperature, so I wouldn’t have detected any anomaly without using thermography.
The E4 also gives a noticeably different temperature reading. According to the manufacturer’s quoted accuracy, the TG165 is indicating a temperature from 22-25°C, and the E4 from 29.5-33.5°C. Note there is no overlap between these ranges, even though both instruments had emissivity settings the same and the images were taken seconds apart. I have no way of independently confirming which instrument was accurate, but the E4 came with a calibration certificate. If determining accurate temperature is important, this may be significant, but remember much of the time we are more interested in temperature differences, in which case there is unlikely to be a huge difference between the accuracies of both instruments.
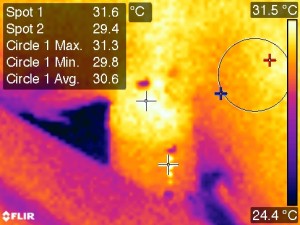 Six recessed downlighters in a kitchen were fitted with high efficiency LED bulbs. However, they were covered with thermal insulation. I wanted to determine how much heat the downlighters were contributing to the surrounding area, so left the lights on for thirty minutes to reach thermal equilibrium with the surroundings, and took a thermographic image using the E4 from above the insulation, with the downlighter partially uncovered, as it was found.
The image (processed in FLIR Tools) shows that in fact the highest indicated temperature on the downlighter (31.6°C) is not significantly in excess of the surrounding insulation at ambient temperature (shown by the circle; average temperature 30.6°C, taken on a hot day.) On this basis I can be pretty confident that there is no fire risk from these LED downlighters, even with the surrounding insulation (although I subsequently put a shield around them anyway). The low temperature shown adjacent to the downlighter (around 24°C) is uncovered plasterboard cooled by the room below. The image is a pure thermographic image, as the low-light conditions meant the visible light camera was not able to add any detail to the image using Thermal MSX® mode.
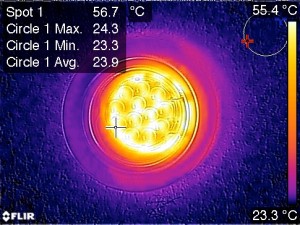 For the sake of interest I also took an image of the bulb from below, immediately after it had been turned off. This shows a maximum surface temperature of 56.7°C against an ambient average (the circle) of 23.9°C). Not bad in comparison with a traditional halogen bulb of the same light output.
This is a Thermal MSX® image, but note that the thermal image appears offset from the visual image, due to the parallax effect from the camera, even though the subject distance was set on the camera. It would be useful to be able to adjust this offset in software, but I was not able to do this.
How often do you find yourself trying to find joists in a ceiling?
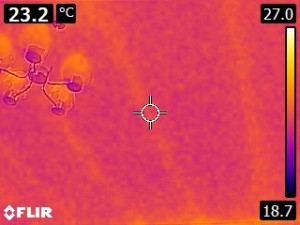
The E4 was able to show the location of joists in this ceiling pretty easily. The image is an unprocessed image taken directly from the camera. There needs to be a cause for a temperature difference for this to work, such as a temperature change within the room which will cause the plasterboard to lose heat more quickly than the joists. If the room and ceiling are in equilibrium, there will be no temperature difference between the plasterboard and joists. I find joist and stud detectors pretty hopeless in most situations; this is a bonus of having a thermographic camera!
Conclusions
I was quite surprised at the overlap between the C2 and E4; in terms of specification and usability, on paper there is surprisingly little to choose between them. Both, however, are markedly different beasts than the TG165, which is more of a hybrid device.
The main reason to purchase the TG165 is price, although if you have specific requirements to accurately determine temperatures above 250°C (up to 380°C) then it’s your only choice of the three devices here. It’s targeted at users who want some very basic thermographic capabilities in a small, lightweight device. It’ll tell you the temperature of a specific object, and give a comparative indication of the temperatures of surrounding objects; however, beyond this you’re not going to get much useful information out of it, and you certainly won’t get thermographic images of sufficient quality to usefully feature in a survey. Nonetheless, it’s fast to use, very straightforward to learn, and gets basic results quickly.
For my money, for the comparative price of the TG165 I’d be wanting to invest a little more cash for the far more capable C2. There’s little the TG165 can do that the C2 can’t, apart from the greater temperature range and laser targeting. However, the C2 adds a great range of functionality, and gives fast, easy access to reasonable quality thermographic images from which quantitative data can be effectively drawn. It’s small enough to fit in a pocket, but versatile enough to become part of a daily-use toolkit.
The next price hike to the E4 makes slightly less sense. The main benefits of the E4 are a slight increase in temperature range, faster startup time, interchangeable batteries, a range of pre-programmed emissivities and a calibration certificate (which may be a deal-breaker to those selling thermographic surveys; although most people in that position will be spending in the 4-figure bracket for their cameras.) If these things are desirable to you, you’re quite likely to be considering the E4 as the cheapest of a set of more professional thermographic devices, and may want to consider one of its more capable siblings with a higher sensor resolution. Once you’re in the multi-thousand-pound bracket, you may even want to purchase a C2 as a useful companion to your “main” thermographic camera which can always be on-hand and ready to use.
With all three devices on my desk, time after time I found myself reaching for the C2 and popping it in a trouser pocket to take on-site “just in case”. In terms of a buying a useful, convenient tool which is capable of producing perfectly respectable results with minimal effort, my preference would be the C2: put it in a pocket, take it to jobs with you and get some use from it.
However, when I knew I was going to need to obtain good-quality thermographic data - such as for further investigation of issues highlighted by the TG165 - I’d pick up the E4. The reasons for this are more subtle - the data it generates are almost identical - but the extra weight and control design makes aiming it and holding it steady slightly easier, the controls (while perhaps not so intuitive initially) are quick and easy to use in a workflow, and, in a nebulous way, it feels like a more professional tool. So if you’re the person who buys a £20 screwdriver instead of a £5 screwdriver because it feels better in your hand, it saves you a few seconds of time and you get more satisfaction using it, and you think you’ll be holding a thermographic camera in your hand for a reasonable portion of the day, the E4 may be the weapon of choice.
Written by David French, Devonia Electrical